Curbing the Consumption of Soft Drinks in New Zealand: Is Tax the Solution?
Article authors - Lin Mei Tan* and James Xun Liu*. (This article originally appeared in the New Zealand Journal of Taxation Law and Policy - (2014) 20 NZJTLP 203)
Obesity is an ongoing problem in many countries including New Zealand and its long-term health consequences impact on society through increased health care costs and losses in productivity. Although different types of unhealthy food contribute to obesity, the one singled out as being the leading single contributor is soft drink. As a result, the current focus in many countries, rather than being on healthy food in general, is to consider the use of the fiscal system to reduce the consumption of soft drinks. New Zealand is one of the many countries that do not have a tax system that specifically targets the consumption of soft drinks even though statistics show the correlation between increased consumption of soft drinks and obesity. This article provides some insights into several issues that have been raised in the literature on whether taxation should be used to regulate the consumption of soft drinks.
1.0 INTRODUCTION
The shocking news that a New Zealand woman’s daily 10-litre[1] intake of Coca-Cola might have contributed to her death[2] has once again drawn considerable attention to the detrimental health effects of excessive consumption of soft drinks. The American Heart Association Meeting Report 2013 indicates that soft drinks may be linked to around 180,000 deaths in the world each year.[3] Soft drinks[4] have high sugar content and frequent consumption of such drinks easily adds calories to an individual’s diet with little nutritive value.[5] There is ample evidence to show that soft drinks consumption is associated with health risks and obesity. With the rate of obesity[6] on the rise worldwide, excessive consumption of soft drinks is becoming a serious [(2014) Vol 20:2 NZJTLP 203, 204] health threat. However, which approach or strategy to use to limit soft drink consumption and whether the Government should intervene by introducing a soft drink tax remains controversial. There are some countries (for example, Mexico, France, Finland, the Netherlands and the United States) that impose a sales tax or excise tax on soft drinks. But many other countries are hesitant to do so in the absence of clear evidence that a tax will have a significant effect on people’s consumption behaviour or on obesity. Fear of opposition from voters or the beverage industry to a soft drink tax is perhaps another reason.[7] As a result, it remains an issue often debated by regulators, health experts, researchers, soft drink manufacturers and the public worldwide.
New Zealand is one of many countries that do not have a tax that specifically targets the consumption of soft drinks. However, statistics showing increases in obesity and the consumption of soft drinks are disturbing. According to the Global Market Information Database,[8] New Zealand was ranked ninth out of 18 developed countries in soft drinks consumption in 2002, as about 84.2 million litres of soft drink were consumed in that year. One recent statistic shows the average intake of soft drink in New Zealand has increased from 20.98 litres per person in 2003 to 22.96 litres per person in 2009.[9] These statistics suggest that New Zealanders’ level of soft drink consumption is not low and the trend appears to be on the rise in recent years. With growing evidence of its link to obesity and other health problems, soft drink consumption is not a trivial issue and ways to help control excessive consumption need to be considered. One question often raised is: should a tax on soft drinks be implemented in New Zealand?
This article will provide some insights into several issues that have been raised in the literature on whether taxation should be used to regulate the consumption of soft drinks. Section 2 reviews the economics and nutrition/health literature on the arguments for and against using tax and non-tax strategies to curb consumption. Evidence supporting their effects on consumption and health will be examined in section 3. Section 4 looks at the New Zealand situation in terms of soft drink consumption, the current public health status and considers whether New Zealand should also introduce its own soft drink tax to address the obesity epidemic. Section 5 concludes.
2.0 LITERATURE REVIEW
2.1 Why the Interest in Soft Drinks?
... consuming soft drinks ... reduces appetite control, leading to increases in weight gain and a risk of obesity
Research on the health risks associated with the consumption of sugary drinks is more abundant than research on the risks from any other food.[10] A number of recent studies have reinforced the highly associated relationship between sugar-sweetened soft drink (referred to as soft drink[s] hereafter) consumption and [(2014) Vol 20:2 NZJTLP 203, 205] the obesity epidemic.[11] For example, two cross-sectional studies[12] provide statistically significant evidence of a positive association between increased soft drink consumption and body weight gain. Soft drinks have been identified as one of the most significant contributors to being overweight, obesity, and other associated health issues such as type-II diabetes, cardiovascular disease and dental caries in studies carried out by health and nutrition researchers.[13] A study by Ludwig, Peterson and Gortmaker[14] further shows that the odds ratio of becoming obese increases 1.6 times for each additional can or glass of soft drink a child consumes each day. In contrast, drinking diet soft drinks was negatively associated with obesity.
A further downside of consuming soft drinks is that it also reduces appetite control, leading to increases in weight gain and a risk of obesity.[15] Nutritionists argue that as consumption of soft drinks is negatively associated with intake of essential nutrients such as minerals and proteins, it may ultimately lead to dental erosion, chronic diseases and other negative health consequences.[16] It is therefore not surprising to see that soft drinks are ranked as the least healthy beverage group by nutritionists.[17]
Of concern is that the negative effects of excessive soft drink consumption do not appear to deter people from drinking them. The total consumption of soft drink has in fact grown rapidly from 71.72 billion litres in 2003 to 88.06 billion litres in 2009 over 52 countries in the world.[18] Furthermore, sales of soft drinks are expected to climb from $291 billion in 2010 to $310 billion in 2015 in the “Group of Eight” countries (that is, Canada, France, Germany, Italy, Japan, Russia, the United Kingdom and the United States)[19].
Why is consumption of soft drinks so high? A number of reasons can be offered to explain the high intake and they include the following. First, soft drinks are available, easily accessible (for example, in supermarkets, cafes, fast food chains, vending machines in schools), and affordable, particularly for the low-income group.[20] People may also consume more than they need when fast food chains offer bottomless cups, free refills or cheaper super-sized soft drinks. Second, soft drinks are a product that is extensively [(2014) Vol 20:2 NZJTLP 203, 206] marketed.[21] Different marketing strategies are used by soft drink manufacturers to lure both adolescents and young children, and they appear to be successful.[22] Third, some consumers are better informed about unhealthy beverages, but others may still be ignorant of the adverse long-term health effects or do not seriously consider the risks of excessive consumption.[23] Behavioural economists point out that consumers do not always make rational choices that will maximise their self-interests. Irrational decisions are made because consumers may lack the will power to change consumption habits, or are unable to work out the costs and benefits of consuming certain food due to information processing limitations.[24] The above reasons perhaps help to explain why soft drinks have become a popular if not a common part of many people’s diets in their everyday lives. In the United States, it was found that sugary drinks are the most consumed snack by adults and the largest source of added sugar in the diets of all Americans.[25]
2.2 Ways to Curb the Consumption of Soft Drinks
Dealing with soft drinks sales and consumption is a challenging task for regulators. They have to ensure that any specific regulations will enhance citizens’ social well-being (for example, health) and will not jeopardise the economic growth of the country. Government intervention should only take place if there is strong evidence that the benefits will outweigh the costs; otherwise, they may be accused of running a nanny state. The economic justification for government intervention is when the market is unable to reach its optimal production and consumption.[26] There are a number of reasons why markets fail and they include imperfect information (or information asymmetry) and the existence of externalities. Many people who consume soft drinks are not aware of or underestimate the risk of long-term health issues associated with soft drink consumption. The health consequences of excessive consumption of soft drinks are not limited to obesity and overweight issues. Other potential health problems such as heart diseases, type II diabetes, and even death, would lead consumers and society to bear the extra burden of health care costs.[27] If consumers do not have the correct knowledge of the long-term adverse health effects of the consumption of soft drinks, and if price will help consumers to make healthier choices, then there is room for a “paternalistic” policy to control these negative externalities.[28]
There are several intervening strategies a government could use to help control the intake of sweetened drinks. They can be classified under two broad categories: non-tax strategies and tax strategies. [(2014) Vol 20:2 NZJTLP 203, 207]
2.2.1 Non-tax strategies
A number of countries have restricted or banned food marketing to protect young children from the aggressive marketing of soft drinks. Since 1980, Canada has banned all advertising aimed at children below 13 and Sweden did the same for children under 12 in 1991
A number of non-tax strategies can be used to support behaviour change to reduce the intake of soft drinks and they include: media and educational campaigns on healthy beverages and physical activity, controls on the marketing and sale of soft drinks (for example, in schools, and limits on portion sizes), and labelling and consumer information requirements.[29]
Many of the suggested non-tax strategies target schoolchildren or young children as changes in food habits and physical activity are more likely to occur at an early age than in adulthood. Several studies have also shown that a higher caloric intake from soft drinks among younger children will persist into adulthood, thereby increasing the risk of obesity.[30] Given the captive environment of many schools, schools are an obvious site for nutrition intervention. Schools can certainly help to promote healthy eating and physical activity, as well as regulating the types of beverages that can be sold in schools.[31]
The availability of soft drink vending machines at schools is a cause for concern as it provides schoolchildren easy access to such drinks. Vending machines, if filled with energy-dense, nutrient-poor food and beverages, can make unhealthy choice the only or easy choice.[32] A study carried out by Weicha et al[33] on the dietary habits and purchases of nearly 1,500 students in 10 Massachusetts middle schools with vending machines that sold soda or other sugar-sweetened beverages shows that these drinks were purchased by almost three times as many students as those that purchased the next most popular item – water. The average number of servings of sugar-sweetened drinks per day increased by 20 per cent for those who purchased one to three items from school vending machines per week, and by 70 per cent for those with four or more purchases from the machines per week. School vending machines therefore make independent contributions to total sugar-sweetened beverage intake that increases with repeated exposure or use. However, a 2013 United States nationwide investigation by Terry-McElrath, O’Malley and Johnston[34] of more than 9,000 students’ consumption of soft drinks found that there was no significant relationship between soft drink availability and students’ consumption other than for African-American high school students. The implication of their study is that the removal of soft drinks from school may be effective especially for certain student groups.
Despite the mixed findings, there appears to be wide support for some sort of control imposed on vending machines. In-school access and purchase can be controlled by banning soft drinks at school, banning soft drink vending machines, or replacing soft drinks with bottled water and drinks of high nutritional value or diet drinks.[35] Such intervention will further help to promote a healthy learning environment and the development of good dietary habits.[36] In some countries like the United Kingdom and France, and some [(2014) Vol 20:2 NZJTLP 203, 208] states in the United States, the sale of sugar-sweetened drinks in school cafeterias or in vending machines is already banned or restricted.[37]
Another strategy that may gain wider support is to educate the public about the negative effects of excessive consumption of soft drinks, in order to change their drinking habits. This strategy of voluntary self-regulation is palatable for those who view that decisions should be made by individuals as to whether to consume unhealthy food and beverages and they need not be subjected to public health paternalism.[38] However, for people to make informed decisions they need to be made aware of the risk of adverse health effects associated with a high intake of soft drinks. Educational campaigns funded by the government can focus on the benefits of increasing consumption of healthy drinks such as water and of “drinking responsibly”.[39] A variety of media can be used on a regular basis to disseminate such information, for example, television, radio, billboard advertising, and flyers. There is evidence to indicate that focused national, community and school-based media and educational campaigns are effective in increasing the knowledge and consumption of specific healthy foods.[40] Nevertheless, some studies show that even though information campaigns have positive impacts on food consumption they have been neither sufficiently effective at changing behaviour [41]nor successful in reversing the rising trend in obesity and other diseases.[42] Despite the mixed findings, a number of countries (for example, Denmark, Brazil, Australia, and Canada) have some form of public awareness campaigns that focus on healthy eating in general but few are designed to discourage the consumption of a specific product like sugar-sweetened beverages.[43]
Education can also come in the form of information provided on the physical product. For instance, labelling of the product particularly its sugar content and nutrition facts, would help people to make informed choices when buying a product. Golan, Kuchler and Mitchell[44] provided evidence that consumers read labels and alter their purchase decisions but there is limited evidence that labels produce dietary change.[45] A number of countries have passed laws mandating nutrient lists on food (for example, Canada, Argentina, the United States, Malaysia, and Thailand).[46] Some countries even have consumer-friendly labelling schemes developed by the government that are voluntary, for example, “traffic light labelling”[47] in the United Kingdom and the Keyhole scheme[48] in Sweden, Norway and Denmark.[49] [(2014) Vol 20:2 NZJTLP 203, 209]
Commercial beverage advertising and promotion is also an area of concern. Soft drink companies spend significant amounts of money marketing their products on television, outdoors, in print, online, in schools, and through other channels, and exposure to this type of marketing significantly influences children’s and adolescents’ diets and related health outcomes.[50] Cross-sectional and longitudinal studies have shown that time spent watching television is positively associated with obesity and being overweight.[51] One of the reasons behind this association is that television viewing is linked to an increase in consumption of fast food and energy-dense snacks. Goris et al’s study[52] on young children in six Western countries[53] suggests that the contribution of television advertising of foods and drinks to the prevalence of childhood obesity differs distinctly by country (from four per cent to 40 per cent). A number of countries have restricted or banned food marketing to protect young children from the aggressive marketing of soft drinks. Since 1980, Canada has banned all advertising aimed at children below 13 and Sweden did the same for children under 12 in 1991.[54] In the United Kingdom, the advertisement of sugar-sweetened drinks during children’s television programmes is also banned.[55] In Korea, some restrictions on advertising food on television to children were imposed in 2012, and in Ireland advertising sugary food including drinks was banned during children’s programmes in September 2013.
2.2.2 Tax strategies
 2.2.2.1 Rationale
The desirability of introducing a form of “fat tax”, that is, a tax on soft drinks, has been debated in many countries, even more recently in some countries like the United States, Mexico, Denmark and France. A tax on soft drinks is generally advocated by those who believe that it would increase the sale price of soft drinks as the tax will be passed on to consumers. As the price of a product is considered to be one of the most important factors influencing food choices, this pricing strategy (that is, taxing soft drinks) has the potential to dissuade consumption and reduce obesity or other health problems.[56] Proponents[57] of a soft drink tax argued that the rationale behind such a tax is not very different from the taxing of tobacco/cigarettes, which has been used successfully as a strategy to control or deter smoking. Similarly, taxing soft drinks could further act as a signal to consumers that soft drinks are unhealthy or of low benefit. [(2014) Vol 20:2 NZJTLP 203, 210]
The imposition of a tax on soft drinks will also generate additional revenue for the government. The revenue could be used to fund other public services or could be earmarked to support health programmes and education.[58]
2.2.2.2 Types of tax
The most common type of tax on soft drinks is the ad valorem tax or excise tax. Nearly two-thirds of all states in the United States tax soft drinks using either of these taxes.[59] An ad valorem tax is a tax levied as a percentage of the price or value of goods and services[60] often at the producer, wholesaler or distributor level. A good example is the value-added tax/goods and services tax (VAT/GST). Another example is the sales tax, which is a tax imposed as a percentage of price on a broad range of goods and services and is generally imposed at the point of sale to consumers.[61] Jensen and Smed[62] view that a tax on the retail price of food products (for example, by using a general percentage tax) is not a satisfactory tool in regulating individuals’ total energy intake as it does not target critical nutrients (for example, sugar, fats, and artificial sweeteners).
Some governments have used the ad valorem tax by merely tinkering with their existing VAT/GST or sales tax system to discourage soft drink consumption. For instance, the VAT/GST rate on soft drinks may be increased as compared to other food products, or soft drinks can be removed from the category of exempted, reduced rate, or zero-rated VAT/GST food and beverages and be therefore taxed at the standard rate. Similarly, countries with a sales tax system may remove soft drinks from the category of exempted sales tax food items.[63] In the United States, most states (for example, Colorado and Washington DC) do not exempt soft drinks under their sales tax system. As of 1 January 2009, the average sales tax on soft drinks in 33 United States states is 5.2 per cent.[64]
An excise tax on soft drinks can target the sugar content; the higher the sugar content, the higher the tax for manufacturers.
An excise tax is a per unit tax and the tax base is determined by the weight, strength or quantity of the product.[65] It may be imposed at any stage of production or distribution although it is normally imposed on the manufacturer as it is easier to collect the tax.[66] An excise tax on soft drinks can target the sugar content; the higher the sugar content, the higher the tax for manufacturers. This type of tax may therefore provide an incentive to manufacturers to lower the sugar content to reduce or minimise taxes.[67] In contrast to the sales tax where tax is applied only at the time of purchase, the burden of the excise tax is more visible to the [(2014) Vol 20:2 NZJTLP 203, 211] consumer as it is embedded in the price.[68] Unlike the ad valorem tax, excise taxes are also more amenable to earmarking the revenue collected to fund various public health programmes.[69] For these reasons, the excise tax is deemed to be more effective at reducing soft drink consumption. Brownell et al[70] suggest that by introducing an excise tax of one cent per gram of sugar, it would effectively reduce a minimum 10 per cent of calorie consumption from soft drinks, which is sufficient for an individual’s weight loss and reduction of health risks.
Excise tax on soft drinks is used in a number of countries because it has the potential not only to curb excessive consumption but also to generate tax revenue at a low cost.[71] Some countries have imposed an excise tax based on per litre (or kilogram) of sugar-sweetened drink or a certain percentage of tax on the price of sugar-sweetened drinks. Norway, for instance, has an excise tax on soft drinks set to NOK 7.05[72] per kilogram. In October 2013, the Mexican Government approved a tax of MXN 1[73] per litre of sugary drinks. The French Government introduced a tax of about EUR 7.16 per hectolitre on beverages with added sugar (EUR 0.072 per litre [74]or EUR 0.024 for a 33 centilitre can) in January 2012.
Recognising the limitations of the sales tax, a number of cities and states in the United States (for example, San Francisco and Colorado) have considered the use of excise taxes on soft drinks ranging from one to two cents per liquid ounce (resulting in about a 20 to 40 per cent price increase)[75]. However, some of the proposals to tax soft drinks were abandoned due to strong opposition from various lobby groups (such as the beverage industry), including those who are anti-paternalism.[76] In other countries, the effect of a soft drinks tax on obesity has been debated and challenged. For instance, the Fijian tax has been challenged by the domestic soft drink industry because of its impact on their operations; as a result, the Government has replaced the excise tax with other types of taxes.[77] Interestingly, Denmark, one of the pioneers of the soft drinks tax which was introduced in the 1930s (based on DKK 1.64 per litre)[78], has recently scrapped the tax because the Government sees the need to stimulate favourable conditions for growth and employment. The other reason for abolishing the tax is that the Danish Government acknowledges the regressivity of the soft drinks tax. Excise tax, a form of indirect tax, is regressive and is usually one of the reasons put forward by those against the adoption of a soft drinks tax.
2.2.2.3 Why is it regressive?
An equity issue often raised with regards to a tax on food is that it is regressive in nature. This is because people with lower incomes spend a larger percentage of their income on food and beverages than those [(2014) Vol 20:2 NZJTLP 203, 212] with higher incomes.[79] Some countries like Australia addressed the regressivity issue by removing the GST on certain foods, particularly healthy food. However, in the case of a soft drinks tax, it could be argued that it might be an effective measure particularly for the lower income group. As Rao et al[80] pointed out, socio-economically disadvantaged population tend to have less healthy diets and a higher disease risk than higher socio-economic groups and cost is usually one of the major factors in this group’s dietary choices. If people with lower incomes are more price-sensitive, then the regressivity is lower than expected.[81] Brownell et al[82] and Eyles et al[83] agree that those of a low socio-economic status would be most affected by the higher cost of such products leading to reduced consumption of a product that has no nutritional value. Therefore, they would derive the greatest benefit as they carry most of the health burden of a high calorie diet. Regressivity concerns can be further minimised if the tax revenue is earmarked for various public health initiatives such as obesity reduction to improve the health and wellbeing of low-income groups.[84]
2.2.2.4 Thin subsidies
Instead of using a fat tax approach to dissuade unhealthy eating/drinking, another approach is to subsidise the consumption of beverages likely to be associated with a reduced incidence of obesity.[85] The thin subsidies approach can help to shift households’ consuming behaviours from unhealthy foods to healthier ones via the pricing mechanism.[86] It might be preferable to a tax as it is progressive and less paternalistic than taxing unhealthy diets. In the case of soft drinks, it can be a subsidy for artificially sweetened beverages or diet soft drinks. A two-prong approach, that is, imposing a fat tax and providing thin subsidies, might work even better as the revenue raised from the tax can be used to finance the thin subsidy.[87]
So, would a fat tax and/or thin subsidies work? The next section addresses their effectiveness on deterring consumption and improving health.
3.0 IS TAX AN EFFECTIVE MECHANISM?
3.1 Will the Tax be Passed on to Consumers?
The effectiveness of a soft drinks tax will depend on whether the tax will in the first place be passed on to consumers.[88] Pomeranz [89]points out that there is no guarantee that manufacturers will simply pass [(2014) Vol 20:2 NZJTLP 203, 213] through the tax on the price of sugary beverages alone as they may choose to spread the price increase among a wider range of their products. For example, manufacturers could apportion the tax among all of their products, which would nullify the impact of the tax. The strategic pricing that may be adopted by the industry therefore must not be ignored as it will lead to mis-estimating the impact of taxation on consumption.[90]
However, there is evidence suggesting that in the case of food, the final food price is likely to be adjusted in response to a tax policy.[91] The supply price elasticity provides an indication of how much of any change in food subsidy or tax is passed on to consumers.[92] Prior studies[93] regarding the excise tax indicate that manufacturers and retailers are more likely to pass their tax burdens on to customers, more so with processed food than with fruits and vegetables which are subject to seasonal supply constraints.[94] In their study on soft drinks, Besley and Rosen[95] estimate that an increase in the soft drink tax rates in the United States will lead to an increase in the price of soft drinks.
3.2 Will it Discourage Consumption?
Raising the price of soft drinks may not work on everyone. It will not have much effect on health if consumers are not dissuaded from buying them even at an increased price. The behavioural economics literature suggests that whether it will work depends on the sensitivity of the consumer towards prices.[96] The price elasticity (PE) of a soft drink refers to changes in the demand of a soft drink due to changes in its price; the higher the price elasticity, the more purchase volume changes as a result of price changes.[97] Food is generally considered to be relatively inelastic as it is a necessity.[98] The United States studies show PEs for food ranging from -0.27 to 0.81, with soft drinks being identified as one of the foods most responsive to price changes (0.7 to 0.8). Studies on the impact of food prices also show that they may impact more on certain groups of people (for example, youths, and lower income groups), or those with elevated body mass index (BMI), rather than impact other groups (for example, older, healthier, and higher income groups).[99] [(2014) Vol 20:2 NZJTLP 203, 214] Economists estimate that the average price elasticity for sugary beverages is in the range of -0.8 to 1.2, meaning that a 10 per cent increase in price should reduce consumption by about eight to 12 per cent.[100]
There is a growing body of research in recent years that focuses specifically on the effectiveness of taxes on soft drinks. For instance, Tiffin and Arnoult[101] in their investigation of 6,760 households’ expenditure data in the United Kingdom concluded that fiscal measures are relatively effective in disciplining either soft drinks or other unhealthy food consumptions. Gustavsen and Rickertsen,[102] who examined the effects of increasing VAT for soft drinks from 13 to 25 per cent in Norway, found that the increased tax has more impact on light and moderate drinkers as compared to heavy drinkers. This result is interesting as light and moderate consumption poses less health risk than heavy consumption, and if the tax has little effect on problem drinkers then it defeats the purpose of imposing a tax on soft drinks.[103] Some studies[104] show that although a tax on soft drinks would lead to a decrease in consumption, the extent is dependent on the rate of the tax.
There are a substantial number of studies arguing for the benefits that may be brought about by the government implementing thin subsidies on certain categories of food, thus making them more affordable to lower income groups. Cash, Sunding and Zilberman’s[105] study on thin subsidies for fruits and vegetables in the United States found that a thin subsidy could be a potent method for altering consumer behaviour particularly in low-income households. Nnoaham et al[106] examined the effect by income group of targeted food taxes and subsidies on nutrition, health and expenditure in the United Kingdom and suggest that a tax on unhealthy foods, combined with the appropriate amount of subsidy on fruits and vegetables, could lead to significant population health gains. In the context of soft drinks, Schroeter, Lusk and Tyner[107] find a decrease in the price of diet soft drinks through thin subsidies in the United States leads to the reduction of weight of individuals as the lower-priced diet food changes consumers’ purchasing preference.
3.3 Will it Reduce Obesity?
Although it is clear that a tax on soft drinks has the potential to influence consumption, its impact on obesity and weight outcomes is less clear. Briggs et al[108] point out that some studies merely show an association with a reduction in consumption but no indication is provided about the tax’s impact on health. Those studies that did examine the impact on health produced mixed results. Some researchers[109] found a decrease in soft drink consumption is positively associated with a reduction in health problems such as [(2014) Vol 20:2 NZJTLP 203, 215] being overweight or obese whereas others suggest that the taxes have no or little impact on BMI or obesity rates in adolescents.[110]
Recent research indicates that a higher tax on soft drinks is required to have a major impact on consumption and obesity rates.[111] Chouinard et al[112] show a 10 per cent increase in the price of sugar products in the United States may result in a decreased household total energy purchase (for example, total energy purchase reduced by 0.79 per cent for top earning families and by 1.20 per cent for moderate income families). Fletcher, Frisvold and Tefft[113] show that an increase of one percentage point in the United States soft drink tax rate leads to a small decrease in BMI of 0.003 points. The influence of soft drink taxes also varies across demographic groups; soft drink taxes have a large influence on BMI and obesity for low-income adults and Hispanics. They conclude that overall, the effect is small even if the tax rate is increased, particularly where reductions in caloric intake from the soft drinks tax would be largely offset by increased calories from other beverages (for example, high-fat milk). If people can substitute with other drinks which have similar calories, then there is no net change in caloric consumption and no significant weight changes. However, if only partial substitution occurs in response to changes in the relative prices of soft drinks, then a soft drinks tax would significantly reduce the net caloric intake, weight and obesity among children and adults. Briggs et al[114] argue that whereas taxes on unhealthy foods may be problematic due to unintended substitution effects (for example, a tax on foods high in saturated fat may lead to a shift towards salty foods), the potential substitutes for sugar-sweetened drinks (for example, diet drinks, fruit juice, milk and water) are probably less harmful for health.
Other studies which examine weight outcomes generally find that food-related price responsiveness is greater among young people, those on lower incomes, and those already at a higher weight.[115] Chaloupka, Powell and Chriqui[116] viewed that a tax of a cent or two per ounce of sugar-sweetened beverage in the United States will raise prices enough to reduce net caloric intake and obesity. Even if a tax has little impact on overall caloric intake as some researchers suggest, they are of the view that if people substitute with healthier alternatives it would reduce the negative health consequence of soft drink consumption. The United States Department of Agriculture estimates that a 20 per cent tax on caloric sweetener beverages would reduce caloric intake by 37 calories per day or 3.8 pounds (approximately 1.72 kilogram) per year for adults and 43 calories per day or 4.5 pounds (approximately 2.04 kilograms) per year for children.[117] The latest research by Briggs et al[118] in the United Kingdom shows that taxation needs to be at least 20 per cent to have a significant effect on obesity and cardiovascular disease.
Overall, existing evidence is mixed in terms of the effectiveness of soft drink taxes on weight outcomes or in reducing obesity. Extant literature suggests that more research is required to examine the impact of large changes in the relative prices of soft drinks on weight outcomes. [(2014) Vol 20:2 NZJTLP 203, 216]
4.0 THE NEW ZEALAND SCENE
Soft drinks are commonly defined as non-alcoholic beverages in New Zealand and they include many types of sugared drinks such as fruit juice, powdered fruit drink, cordial, fizzy drink, energy drink, sports drink and flavoured waters.[119]
Table 1: Amount of Sugar in Common Drinks[121]
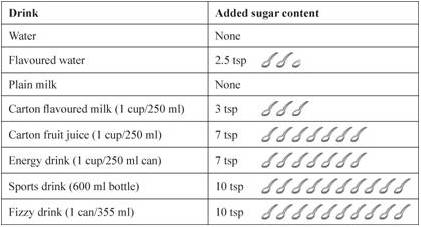
New Zealanders consume a considerable amount of soft drink. Out of 18 developed countries, New Zealand ranked ninth with 84.2 million litres of total soft drink consumption in 2002.[123] The Ministry of Business, Innovation and Employment published a report[124] which shows that the New Zealand soft drink industry financial turnover increased by seven per cent between 2009 and 2010, and that the industry is a duopoly controlled by two large international companies, Coca-Cola Amatil[125] and Frucor Beverages Ltd.[126] Both companies’ turnovers in 2010 were $493 million and $380 million respectively.
Apart from the statistics showing an increasing trend of soft drink consumption in New Zealand, evidence from the OECD Database[127] indicates that the percentage of obese people in New Zealand has also increased steadily from 20.6 per cent in 1997 to 25.6 per cent in 2003, eventually peaking at 28.4 per cent in 2012. Additionally, the 2011-12 New Zealand adult health survey[128] shows that overweight and obesity issue is [(2014) Vol 20:2 NZJTLP 203, 217] becoming more substantial. Figure 1 demonstrates about 28 per cent adults in New Zealand are obese and about 35 per cent are overweight.[129] Obesity rates were also higher among Pacific adults (62 per cent), Maori adults (44 per cent), Pacific children (23 per cent) and Maori children (17 per cent). The 2012-13 statistics show no reduction in obesity; on the contrary, there was an increase to 31 per cent of adults being obese. In the case of children, the 2012-13 childhood obesity rate is similar to the previous year with 11 per cent of children obese.[130]
Figure 1: New Zealanders’ Health Status (BMT) Measured in Percentage of Total Population[131]
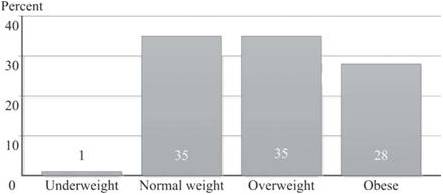
Notes: Based on BMI using measured height and weight. Due to rounding, individual figures may not sum to 100 per cent.
The overweight and obesity issue is not new in New Zealand. Although New Zealand has a wealth of experience dealing with the overweight and obesity issue over the past 20 years, significant improvements have not been achieved.[133] Lal et al[134] estimate the overweight and obesity problem would cost in impaired health and weakened productivity, possibly ranging from $722 million to $849 million a year in New Zealand. The overweight and obesity issue certainly imposes a financial burden on the country’s revenue now and potentially in the future.
Compared to the significant number of studies on soft drink taxes conducted overseas (particularly in the United States and the United Kingdom), research on the effects of taxing soft drinks in the New Zealand environment is sparse. Research is slowly emerging but many studies tend to focus on food pricing strategies [(2014) Vol 20:2 NZJTLP 203, 218] in general rather than just soft drinks.[135] Between February 2007 and 2009, Ni Mhurchu et al[136] conducted a study in eight New Zealand supermarkets and found that neither a 12.5 per cent price discount[137] nor tailored nutrition education[138] had a significant effect on nutrient purchases. However, those who were randomly assigned to receive price discounts on food bought significantly more predefined healthier foods. Their findings suggest that pricing strategies have the potential to improve healthy diets. Like Ni Mhurchu et al,[139] Blakely et al[140] also found in their study no overall association of a 12.5 per cent price discount or tailored nutritional education with healthy food purchases. Their study further shows that price had a weaker or null effect among Maori compared to European New Zealanders, which is inconsistent with Ni Mhurchu et al’s[141] and overseas studies which indicate that price elasticity is usually greater among lower socio-economic groups. The results of these two studies appear mixed, suggesting that there is no clear evidence that pricing strategies will reduce obesity.
Using the food expenditure data from national household economic surveys in 2007-08 and Food Price Index data from 2007 and 2010, Ni Mhurchu et al[142] carried out a study to estimate the price elasticity values for major common food groups in New Zealand by income and ethnicity. Their results show that generally, the PE estimates ranged from -0.44 to -1.78, which are comparatively higher than those reported in other countries such as the United States and the United Kingdom. This is not surprising as pointed out by Pelletier, Graham and Laska:[143] price elasticity is country-specific as complements and substitutive goods tend to be diverse across countries. Ni Mhurchu et al[144] conclude that targeting food pricing policies by taxing fat food or providing subsidies on healthy food have the potential to improve people’s diets, particularly Maori and lower income groups. Their estimates indicate that a 10 per cent tax on carbonated soft drinks could lead to a 13 per cent decrease in population purchases of these products, while a 10 per cent subsidy on fruit could lead to a 6.5 per cent increase in purchases.
To gauge the public’s perception of an excise tax on unhealthy food, Helene Stuart and Adrian Sawyer[145] surveyed educators and families of a New Zealand early childhood home-based care organisation (174 participants) in 2012. Their findings indicate that although there is general agreement that a price increase on unhealthy food would decrease consumption, removal of GST from healthy food is considered to be a more effective fiscal intervention to encourage consumption of healthy food. [(2014) Vol 20:2 NZJTLP 203, 219]
In 2008, a group of researchers[146] published their research project (called ENHANCE) on the environmental influences on food security/insecurity[147] and physical activities among Maori, Pacific and low-income families. This project was jointly funded by the Health Research Council and the Ministry of Health. The researchers considered the removal of GST from healthy basic food as it is regressive in nature but noted that every household, rich or poor, would benefit if this measure was used. In contrast, the provision to poor families of a smart card (like food stamps) providing discounts on healthy nutritious food is considered more promising and worthy of future research. Based on their view, this has the potential to affect food security and also the nutrient quality of food purchases. However, to date this proposal has not been adopted.
New Zealand does not have a soft drinks tax. It has a goods and services tax (GST), which is a tax on value-added goods and services at the rate of 15 per cent. Unlike some other countries (for example, Australia and the United Kingdom), it does not differentiate between types of goods such as food, health care, and children’s clothing.[148] This “broad-based with few exemptions” GST system is considered to be the best tax of its type internationally.[149] The current Government appears to advocate self-regulation, education, responsible parenting and self-control. It generally does not favour using the GST system to encourage healthy eating or discourage unhealthy diets despite such interventions being viewed favourably by various lobby groups.[150] There are a number of lobby groups in New Zealand (for example, Fighting Sugar in Soft Drinks (FIZZ), Diabetes New Zealand, and Fight the Obesity Epidemic (FOE)) that advocate using fiscal measures to specifically increase the price of soft drinks; these groups have not been successful to date.
Nonetheless, other non-tax initiatives on food have been considered by the Government. For instance, the Government launched healthy eating programmes promoting nutrition and physical activity, and provided food and nutrition guidelines.[151] Other initiatives targeting obesity include supporting sports in schools (for example, KiwiSport), Green Prescriptions and the Fruit in Schools programme for low decile schools. There are also food labelling requirements where most food for sale must be comprehensively labelled, but unlike cigarettes, warning labels outlining the health risk are not required (except for energy drinks with high caffeine levels) although this has been lobbied for. As studies have shown that shoppers (in particular Maori, Pacific and low-income groups) find the current labelling systems on the back of food products complicated and hard to understand,[152] the Government announced in November 2013 that research has been commissioned to assess the impact of nutrition labelling on food and consumers’ understanding of it. [(2014) Vol 20:2 NZJTLP 203, 220] A front-of-pack labelling policy based on a five-star rating scale[153] is being considered which might help consumers know at a glance the nutrition information about the food they are buying.
Other suggestions to provide a good start to curb soft drink consumption is the banning or substitution of sugar-based soft drinks with diet soft drinks in vending machines in schools or other public places.[154] Utter et al’s’[155] nationwide study of 3,275 New Zealand students aged 5 to 14 indicating that 58 per cent of students bought their food and drink from the school canteen, with younger students in particular more likely to drink soft drinks five or more times a week, provides support for such measures to be taken. Currently, sugar fizzy drinks and energy drinks are not sold in schools but other soft drinks are not restricted. Some schools have started a zero soft drink policy, although it does not appear to be very successful as schoolchildren can still easily access them from nearby dairies, or supermarkets.[156]
Advertising of soft drinks on television in New Zealand is not banned even though there is evidence to suggest that the duration of television watching (thus more frequent exposure to advertising) influences the frequency of consumption of soft drinks, some sweets and snacks and some fast foods among New Zealand children and young adolescents.[157] Currently, marketing in New Zealand is mainly regulated by the industry-funded Advertising Standards Authority (ASA) rules, which have a Code of Advertising and a Children’s Code for Advertising Food 2010 which all media must comply with. The New Zealand Television Broadcasters’ Council, a self-regulatory body, has a prescribed policy of restricted advertising to children under 14 years of age.[158] However, this restriction does not appear to have reduced food and beverage marketing to children and suggestions have been made for the Government to intervene to restrict food and beverage marketing to children.[159]
It is interesting to note that in the absence of the Government’s willingness to regulate the consumption of soft drinks, and perhaps concern over government intervention at some stage, Coca Cola Amatil revealed their new campaign in July 2013 to help fight the obesity epidemic by: providing smaller portion sizes, offering a wider selection of low-kilojoule beverage options, providing transparent nutritional information in more places including vending machines and supporting physical activity programmes.[160] Although some see these initiatives as a good step to promote the health and well-being of New Zealanders, others are sceptical of a beverage company promoting public health.[161] [(2014) Vol 20:2 NZJTLP 203, 221]
As discussed above, a variety of measures such as pricing, education, marketing and nutrition labelling have been suggested as possible initiatives that can be regulated to curb soft drink consumption. However, it appears that what is lacking at present is robust evidence on the effectiveness of these interventions on the consumption of soft drinks and health outcomes. There is certainly plenty of scope for future research in these areas.[162]
5.0 CONCLUSION
Obesity is an ongoing problem in many countries including New Zealand and it has long-term health consequences which impact on society through increases in health care costs and losses in productivity.[163] Although different types of unhealthy food contribute to obesity, the one singled out as being the leading single contributor is soft drink.[164] As a result, the current focus in many countries is to consider the use of the fiscal system to reduce the consumption of soft drinks rather than on healthy food in general. A tax on soft drinks is also easier to implement than a tax on unhealthy or “junk” food which is more difficult to define. There is also evidence to support soft drinks being more responsive to price changes as compared to other types of food.
Nevertheless, despite the concerns over the increasing trend of soft drink consumption in New Zealand, the current New Zealand Government is unlikely to endorse differentiating goods and services for GST purposes as it would undermine the simplicity of the GST system. Providing concessionary GST rates for healthy food and beverages would generate pressures to extend concessions to other “worthy” goods. An excise tax is perhaps more promising as New Zealand has used a number of excise taxes and levies for public health reasons (for example, tobacco, alcohol and gambling).[165] Such a tax might also encourage manufacturers to reduce sugar in the drinks to make them healthier. A soft drink tax could gain more support if the revenue generated from the tax is earmarked for various activities to reduce obesity and health programmes. Utilising the revenue to subsidise fruit and vegetables is another option but whether people will buy more healthy produce will depend on the types of food people buy or substitute for. It is not easy to predict that a tax such as an excise tax on soft drinks and/or thin subsidies will work as contemplated. As Drenkard[166] points out, people respond to tax changes but not necessarily in the way policymakers want them to. Evidence of taxes reducing obesity is mixed and the effects on different income groups, different cultural groups (for example, Maori, Pacific, Asian, and New Zealand European), or types of drinkers (moderate or problem drinkers), are uncertain. If the main purpose of the tax is to target population obesity, then more evidence is required to show that it will reduce soft drink consumption, calorie intake and obesity.
In the absence of a soft drink tax, it is important that people are made aware of the detrimental effects of excessive consumption of soft drinks. The Government should continuously fund educational campaigns towards healthy food diets, encourage people to reduce sugar intake (as well as salt levels and saturated fats), and increase physical activity. There is also a need to change people’s perceptions, especially those of the lower socio-economic group, that healthy food is always more expensive.[167] These types of educational [(2014) Vol 20:2 NZJTLP 203, 222] campaigns will help people to make informed decisions when it comes to food choices. Some initiatives could also focus on children who do not fully understand the health consequences of soft drinks consumption and who are most vulnerable to aggressive marketing.
Overall, a single strategy may not produce much effect. To successfully curb sugary drink intake certainly requires multiple strategies and initiatives supported by the Government, the people and the beverage industry.
Foot notes
1 There are about 54 teaspoons of sugar in a two-litre bottle of Coca Cola or nine teaspoons of sugar per 355 ml can of Coca Cola: Rose Carr “How much sugar is in that drink?” (1 February 2011) healthy food guide <www.healthyfood.co.nz/articles>.
2 “Coke death finding delayed” Otago Daily Times (online ed, Otago, 15 August 2012). See also “Coca-Cola drinking ‘linked to New Zealander’s death’” BBC (12 February 2013) <www.bbc.co.uk>.
3 American Heart Association “180,000 deaths worldwide may be associated with sugary soft drinks” (news release, 19 March 2013) <http://newsroom.heart.org>.
4 They are also commonly termed as sugar-sweetened drinks or sugar-sweetened beverages which include non-diet sodas, energy drinks and fruit drinks; see Jeff Niederdeppe and others “News coverage of sugar-sweetened beverage taxes: pro- and antitax arguments in public discourse” (2013) 103 Am J Public Health 9208.
5 Kenneth A Couch “Introduction: Health policy and sugar-sweetened beverages” (2011) 30 Journal of Policy Analysis and Management 644.
6 Obesity arises due to a change in the energy balance – more calories taken in than expended: Frank J Chaloupka, Lisa M Powell and Jamie F Chriqui “Sugar-sweetened beverages and obesity prevention: Policy recommendations” (2011) 30 J Policy Anal Manage 662.
7 See Jessica Burns-Grant and Lisa Marriott “An Institutional Perspective on Fighting Obesity via the GST System: A New Zealand Case Study” (2012) 18 New Zealand Journal of Taxation Law and Policy 190 at 199-203, for a discussion of the influence of institutions on food tax policy.
8 NationMaster “Lifestyle > Food and drink > Soft drink > Consumption: Countries Compared” <www.nationmaster.com/country-info/stats>.
9 World Databank: World Development Indicators <www.databank.worldbank.org/data/views/reports/tableview.aspx/>.
10 Kelly D Brownell and others “The Public Health and Economic Benefits of Taxing Sugar-Sweetened Beverages” (2009) 361 N Engl J Med 1599.
11 Debra Hector and others Soft Drinks, Weight Status and Health: A Review (NSW Centre for Public Health Nutrition, Sydney, 2009).
12 See Joyce Giammattei and others “Television Watching and Soft Drink Consumption: Associations With Obesity in 11- to 13-Year-Old Schoolchildren” (2003) 157 Arch Pediatr Adolesc Med 882, and Sun H Kim, Deborah J Morton and Elizabeth L Barrett-Connor “Carbonated Beverage Consumption and Bone Mineral Density among Older Women: The Rancho Bernardo Study” (1997) 87 Am J Public Health 276.
13 See World Health Organization Diet, Nutrition and the Prevention of Chronic Diseases: Report of a Joint WHO/FAO Expert Consultation (WHO Technical Report Series: 916, Geneva, 2003); Vasanti S Malik and others “Sugar-Sweetened Beverages and Risk of Metabolic Syndrome and Type 2 Diabetes: A meta-analysis” (2010) 33 Diabetes Care 2477; and Adam DM Briggs and others “Overall and income specific effect on prevalence of overweight and obesity of 20% sugar sweetened drink tax in UK: econometric and comparative risk assessment modelling study” (2013) 347 BMJ 6189.
14 David S Ludwig, Karen E Peterson and Steven L Gortmaker “Relation between consumption of sugar-sweetened drinks and childhood obesity: a prospective, observational analysis” (2001) 357 The Lancet 505.
15 World Health Organization, above n 13.
16 Lenny R Vartanian, Marlene B Schwartz and Kelly D Brownell “Effects of Soft Drink Consumption on Nutrition and Health: A Systematic Review and Meta-Analysis” (2007) 97 Am J Public Health 667.
17 Geir Wæhler Gustavsen and Kyrre Rickertsen “The effects of taxes on purchases of sugar-sweetened carbonated soft drinks: A quantile regression approach” (2011) 43 Applied Economics 707.
18 Euromonitor International Ltd Who Drinks What: Identifying International Drinks Consumption Trends (2nd ed, London, 2009) <www.euromonitor.com>.
19 Reportlinker “Soft Drink Industry Market Research & Statistics” (2013) <www.reportlinker.com/ci02018/Soft-Drink.html/>.
20 Robert Quigley and Carolyn Watts “Challenging beliefs about the marketing of food” (2005) 118(1218) New Zealand Medical Journal 4.
21 See Hector and others, above n 11.
22 Marion Nestle “Soft Drink ‘Pouring Rights’: Marketing Empty Calories” (2000) 115 Public Health Rep 308.
23 See Chaloupka, Powell and Chriqui, above n 6; and Tomas J Philipson and Richard A Posner “Is the Obesity Epidemic a Public Health Problem? A Review of Zoltan J Acs and Alan Lyles’s Obesity, Business and Public Policy” (2008) 46 Journal of Economic Literature 974.
24Kate Tokeley “Consumer law and paternalism: A framework for policy decision-making” in Susy Frankel and Deborah Ryder (eds) Recalibrating Behaviour: Smarter Regulation in a Global World (LexisNexis, Welington, 2013) ch 7.
25 Rhonda S Sebastian, Cecilia Wilkinson Enns and Joseph D Goldman “Snacking Patterns of US Adults: What We Eat in America, NHANES 2007-2008” (Dietary Data Brief No 4, Food Surveys Research Group, Beltsville Human Nutrition Research Center, Agricultural Research Service, US Department of Agriculture, Washington, DC, June 2011).
26 John Cawley “An economic framework for understanding physical activity and eating behaviors” (2004) 27(3 Supp) Am J Prev Med 117.
27 See Brownell and others, above n 10.
28 Céline Bonnet and Vincent Réquillart “Tax incidence with strategic firms in the soft drink market” (2013) 106 Journal of Public Economics 77.
29 See Briggs and others, above n 13; and Dariush Mozaffarian and others “Population approaches to improve diet, physical activity, and smoking habits” (2012) 126 Circulation 1514.
30 See Chaloupka, Powell and Chriqui, above n 6.
31 Jennifer Utter and others “Food choices among students using the school food service in New Zealand” (2007) 120(1248) New Zealand Medical Journal 22.
32 Delvina Gorton and others “Healthier vending machines in workplaces: both possible and effective” (2010) 123(1311) New Zealand Medical Journal 43.
33 Jean L Wiecha and others “School Vending Machine Use and Fast-Food Restaurant Use Are Associated with Sugar-Sweetened Beverage Intake in Youth” (2006) 106 J Am Diet Assoc 1624.
34 Yvonne M Terry-McElrath, Patrick M O’Malley and Lloyd D Johnston “School Soft Drink Availability and Consumption Among US Secondary Students” (2013) 44 Am J Prev Med 573.
35 See Chaloupka, Powell and Chriqui, above n 6.
36 See Terry-McElrath, O’Malley and Johnston, above n 34.
37 See Briggs and others, above n 13.
38 David Stuckler and Marion Nestle “Big Food, Food Systems, and Global Health” (2012) 9 PLoS Med e1001242.
39 See Chaloupka, Powell and Chriqui, above n 6.
40 Dariush Mozaffarian and others “Changes in Diet and Lifestyle and Long-Term Weight Gain in Women and Men” (2011) 364 N Engl J Med 2392.
41 See David M Cutler, Edward L Glaeser and Jesse M Shapiro “Why Have Americans Become More Obese?” (2003) 17 Journal of Economic Perspectives 93; and Corinna Hawkes Promoting healthy diets through nutrition education and changes in the food environment: an international review of actions and their effectiveness (Background paper for the International Conference on Nutrition (ICN2), Food and Agriculture Organization of the United Nations, Rome, 2013).
42 See Bonnet and Réquillart, above n 28.
43 See Hawkes, above n 41.
44 Elise Golan, Fred Kuchler and Lorraine Mitchell “Economics of Food Labeling” (Agricultural Economic Report No 793, Economic Research Service, US Department of Agriculture, Washington, DC, 2000).
45 See Mozaffarian, above n 29; and Philipson and Posner, above n 23.
46 See Hawkes, above n 41.
47 The traffic label shows at a glance whether the food is healthier (green) or unhealthy (red) with amber denoting middle range.
48 The Keyhole symbol is a positive food label indicating that the food contains less fat, sugar and salt and more dietary fibre than food products of the same type not carrying the symbol. See “About the Keyhole” Norden <www.norden.org>.
49 See Hawkes, above n 41.
50 See Lisa M Powell, Jamie Chriqui and Frank J Chaloupka “Associations between State-level Soda Taxes and Adolescent Body Mass Index” (2009) 45(3 Supp) J Adolesc Health S57-S63; and Chaloupka, Powell and Chriqui, above n 6.
51 Janny M Goris and others “Television food advertising and the prevalence of childhood overweight and obesity: a multicountry comparison” (2009) 13 Public Health Nutr 1003.
52 Above n 51.
53 That is, Australia, Great Britain (England and Scotland only), Italy, the Netherlands, Sweden and the United States.
54 See Sarah Barker “The Obesity Epidemic: Towards a Regulatory Framework to Combat Obesity in New Zealand” (LLM Dissertation, Victoria University of Wellington, 2011).
55 See Briggs and others, above n 13.
56 See Cara B Ebbeling and others “Effects of Decreasing Sugar-Sweetened Beverage Consumption on Body Weight in Adolescents: A Randomized, Controlled Pilot Study” (2006) 117 Pediatrics 673; and Helen Eyles and others “Food Pricing Strategies, Population Diets, and Non-Communicable Disease: A Systematic Review of Simulation Studies” (2012) 9 PLoS Med e1001353.
57 See for example Chaloupka, Powell and Chriqui, above n 6.
58 Daniel Kim and Ichiro Kawachi “Food taxation and pricing strategies to “thin out” the obesity epidemic” (2006) 30 Am J Prev Med 430.
59 Jason M Fletcher, David Frisvold and Nathan Tefft “Can Soft Drink Taxes Reduce Population Weight?” (2010) 28 Contemp Econ Policy 23.
60 Simon James A Dictionary of Taxation (2nd ed, Edward Elgar, Cheltenham, 2013).
61 Jennifer L Pomeranz “Taxing Food and Beverage Products: A Public Health Perspective and a New Strategy for Prevention” (2013) 46 U Mich J L Reform 999.
62 Jorgen D Jensen and Sinne Smed “Cost-effective design of economic instruments in nutrition policy” (2007) 4 International Journal of Behavioral Nutrition and Physical Activity.
63 See Chaloupka, Powell and Chriqui, above n 6.
64 See Chaloupka, Powell and Chriqui, above n 6.
65 See Anne Marie Thow and others “Taxing soft drinks in the Pacific: implementation lessons for improving health” (2011) 26 Health Promot Int 55; and Bonnet and Réquillart, above n 28.
66 See Thow and others, above n 65; and Zhen Miao, John C Beghin and Helen H Jensen “Taxing Sweets: Sweetener Input Tax or Final Consumption Tax?” (2012) 30 Contemporary Economic Policy 344.
67 See Miao, Beghin and Jensen, above n 66.
68 See Chaloupka, Powell and Chriqui, above n 6.
69 See Pomeranz, above n 61.
70 Brownell and others, above n 10.
71 Roy Bahl, Richard Bird and Mary Beth Walker “The Uneasy Case Against Discriminatory Excise Taxation: Soft Drink Taxes in Ireland” (2003) 31 Public Finance Review 510.
72 Equivalent to about NZD 1.38.
73 Equivalent to about NZD 9.2 cents.
74 Equivalent to about NZD 12 cents.
75 See Chaloupka, Powell and Chriqui, above n 6.
76 Jason M Fletcher, David E Frisvold and Nathan Tefft “Are soft drink taxes an effective mechanism for reducing obesity?” (2011) 30 Journal of Policy Analysis and Management 655.
77 See Thow and others, above n 65; and Eyles and others, above n 56.
78 Equivalent to NZD 36 cents.
79 See Pomeranz, above n 61.
80 Mayuree Rao and others “Do healthier foods and diet patterns cost more than less healthy options? A systematic review and meta-analysis” (2013) 3 BMJ Open e004277.
81 See Bonnet and Réquillart, above n 28.
82 Brownell and others, above n 10.
83 Eyles and others, above n 56.
84 See Pomeranz, above n 61.
85 See Grace Lordan and John Quiggin “Should we put a thin subsidy on the policy table in the fight against obesity?” (School of Economics Discussion Paper No 417, School of Economics, The University of Queensland, February 2011).
86 See Eyles and others, above n 56.
87 See W Bruce Traill and others “Effectiveness of Policy Interventions to Promote Healthy Eating and Recommendations for Future Action: Evidence from the EATWELL Project” (2012) Eatwell <www.eatwellproject.eu/en/>; Briggs and others, above n 13; and Rao and others, above n 80.
88 See Miao, Beghin and Jensen, above n 65.
89 Pomeranz, above n 61.
90 World Health Organization WHO Technical Manual on Tobacco Tax Administration (Report No 916, Geneva, 2010) <www.who.int>.
91 See Bonnet and Réquillard, above n 28.
92 Des O’Dea, Delvina Gorton and Cliona Ni Mhurchu “Thin Subsidies and Fat Taxes: Economic Instruments for addressing Food Inadequacy and Nutrition Issues” (Paper for presentation at NZ Association of Economists Conference, Wellington, 1 July 2009).
93 See, for example, Timothy J Besley and Harvey S Rosen “Sales Taxes and Prices: An Empirical Analysis” (1999) 52 National Tax Journal 157; and Donald S Kenkel “Are Alcohol Tax Hikes Fully Passed Through to Prices? Evidence from Alaska” (2005) 95 American Economic Review 273.
94 See O’Dea, Gorton and Ni Mhurchu, above n 92.
95 Besley and Rosen, above n 93.
96 See Christiane Schroeter, Jayson Lusk and Wallace Tyner “Determining the impact of food price and income changes on body weight” (2008) 27 J Health Econ 45.
97 If food prices rise by 10 per cent and the quantity of soft drink purchased falls by five per cent, then the price elasticity of the demand for soft drink is -0.5, that is, price inelastic; see O’Dea, Gorton and Ni Mhurchu, above n 92, and Eyles and others, above n 56.
98 See Cliona Ni Mhurchu and others “Food Prices and Consumer Demand: Differences across Income Levels and Ethnic Groups” (2013) 8 PLoS ONE e75934; and O’Dea, Gorton and Ni Mhurchu, above n 92.
99 See Chaloupka, Powell and Chriqui, above n 6.
100 See Tatiana Andreyeva, Michael W Long and Kelly D Brownell “The Impact of Food Prices on Consumption: A Systematic Review of Research on the Price Elasticity of Demand for Food” (2010) 100 Am J Public Health 216; and Pomeranz, above n 61.
101 R Tiffin and M Arnoult “The Public Health Impacts of a Fat Tax” (2011) 65 Eur J Clin Nutr 427.
102 Gustavsen and Rickertsen, above n 17.
103 Jason M Fletcher, David E Frisvold and Nathan Tefft “The proof is in the pudding: Response to Chaloupka, Powell and Chriqui” (2011) 30 Journal of Policy Analysis and Management 664.
104 See, for example, Schroeter, Lusk and Tyner, above n 96; and Briggs and others, above n 13.
105 Sean B Cash, David L Sunding and David Zilberman “Fat taxes and thin subsidies: Prices, diet, and health outcomes” (2005) 2 Acta Agriculturae Scandinavica, Section C 167.
106 Kelechi E Nnoaham and others “Modelling income group differences in the health and economic impacts of targeted food taxes and subsidies” (2009) 38 International Journal of Epidemiology 1324.
107 Schroeter, Lusk and Tyner, above n 96.
108 Briggs and others, above n 13.
109 See, for example, Schroeter, Lusk and Tyner, above n 96; and Hector and others, above n 11.
110 See Powell, Chriqui and Chaloupka, above n 50; and Chaloupka, Powell and Chriqui, above n 6.
111 See Chaloupka, Powell and Chriqui, above n 6; Fletcher, Frisvold and Tefft, above n 76; and Niederdeppe and others, above n 4.
112 Hayley H Chouinard and others “Fat Taxes: Big Money for Small Change” (2007) 10(2) Forum for Health Economics & Policy 1.
113 Fletcher, Frisvold and Tefft, above n 59.
114 Briggs and others, above n 13.
115 See Powell, Chriqui and Chaloupka, above n 50; and Briggs and others, above n 13.
116 Chaloupka, Powell and Chriqui, above n 6.
117 Travis A Smith, Biing-Hwan Lin and Jonq-Ying Lee Taxing Caloric Sweetened Beverages: Potential Effects on Beverage Consumption, Calorie Intake, and Obesity (Economic Research Report No 100, Economic Research Service, United States Department of Agriculture, July 2010).
118 Briggs and others, above n 13.
119 Ministry of Health “Eating for healthy teeth” (2012) <www.health.govt.nz/your-health>.
121 Ministry of Health, above n 119.
123 See NationMaster, above n 8.
124 See Corilis Food & Beverage Information Project 2011: Sector Stream – Beverages: Final Report (v1.8, Auckland, October 2011).
125 Their drinks include Coca-Cola, Fanta, Sprite, and Coca-Cola Zero.
126 Their drinks include Pepsi, Pepsi Max, Mountain Dew, and 7Up.
127 OECD OECD Health Data 2013: How Does New Zealand Compare (2013) <www.oecd.org/newzealand>.
128 Ministry of Health The Health of New Zealand Adults 2011/12: Key findings of the New Zealand Health Survey (Wellington, 2012) <www.health.govt.nz/publications>.
129 Obesity is defined by the Ministry of Health as having a BMI of 30 or more; see Ministry of Health “Obesity questions and answers” <www.health.govt.nz/our-work>.
130 Ministry of Health New Zealand Health Survey: Annual update of key findings 2012/13 (Wellington, December 2013) <www.health.govt.nz/publications> at vi.
131 Ministry of Health, above n 126, at 34.
133 Boyd Swinburn and A Wood “Progress on obesity prevention over 20-years in Australia and New Zealand” (2013) 14(Supp 2) Obesity Reviews 60.
134 Anita Lal and others “Health care and lost productivity costs of overweight and obesity in New Zealand” (2012) 36 Aust NZ J Public Health 550.
135 See also articles on fighting obesity by Jessica Burns-Grants and Lisa Marriott, above n 7; and Jonathan Barrett “Fat Taxes: A Proportionality Approach” (2012) 18 New Zealand Journal of Taxation Law and Policy 242.
136 Cliona Ni Mhurchu and others “Effects of price discounts and tailored nutrition education on supermarket purchases: A randomized controlled trial” (2010) 91 Am J Clin Nutr 736.
137 The GST rate at that time was 12.5 per cent.
138 That is, education tailored to the recipients’ characteristics such as ethnic group or dietary habits. See Tony Blakely and others “Do effects of price discounts and nutrition education on food purchases vary by ethnicity, income and education? Results from a randomised, controlled trial” (2011) 65 J Epidemiol Community Health 902 at 902.
139 Ni Mhurchu and others, above n 133.
140 Blakely and others, above n 135.
141 Ni Mhurchu and others, above n 99.
142 Ni Mhurchu and others, above n 99.
143 Jennifer E Pelletier, Dan J Graham and Melissa N Laska “Social Norms and Dietary Behaviors among Young Adults” (2014) 38 Am J Health Behav 144.
144 Ni Mhurchu and others, above n 99.
145 Helene Stuart and Adrian Sawyer “An Excise Tax on Unhealthy Food or the Removal of GST from Healthy Food as a Way of Managing Obesity: A New Zealand Perspective” (2013) 19 New Zealand Journal of Taxation Law and Policy 112.
146 See Mat Walton and Louise Signal “An analysis of interactions between factors associated with food security and physical activity” (Working paper for the ENHANCE Research Project, Health Promotion and Policy Research Unit, University of Otago, Wellington, September 2008).
147 Food insecurity refers to not always able to buy the amount and quality of food desired perhaps due to insufficient household income and high prices of food: Walton and Signal, above n 143).
148 See O’Dea, Gorton and Ni Mhurchu, above n 92.
149 Victoria University of Wellington Tax Working Group A Tax System for New Zealand’s Future (Centre for Accounting, Governance and Taxation Research, Victoria University of Wellington, Wellington, January 2010).
150 See Stuart and Sawyer, above n 142, at 113; and Kevin Holmes and Judith Pinny “Is Obesity Degenerating New Zealand’s GST?” (May/June 2011) International VAT Monitor 166 at 167.
151 See Controller and Auditor-General Evolving approach to combating child obesity (Wellington, 2013) <www.oag.govt.nz/reports> pt 1.
152 See Louise Signal and others “Front-of-pack nutrition labelling implementation and research: An exploration of stakeholder views” (2012) 23 Health Promotion Journal of Australia 48.
153 See Nikki Kaye “Research underway on voluntary front-of-pack food labelling” (media release, 7 November 2013) Beehive <www.beehive.govt.nz>.
154 Emme Chacko, Ingrid McDuff and Rod Jackson “Replacing sugar-based soft drinks with sugar-free alternatives could slow the progress of the obesity epidemic: Have your Coke® and drink it too” (2003) 116(1184) New Zealand Medical Journal 1.
155 Utter and others, above n 31.
156 See “Soft drinks in firing line” Western Leader (Auckland, 24 September 2013).
157 See Utter and others, above n 31.
158 It includes: no advertising during pre-school programmes; limited advertising during school-age children’s programmes; separation of programmes and advertisements; limits on repeating advertisements and limits on sponsorship. See ThinkTV Advertising on Television: Getting it right for children (March 2011) <www.thinktv.co.nz>. For a good discussion on regulation of food product marketing in New Zealand, see Sarah Baker “The Obesity Epidemic: Towards a Regulatory Framework to Combat Obesity in New Zealand” (LLM Dissertation, Victoria University of Wellington, 2011).
159 See Julia Lyon Food and Beverage Marketing to Children (Agencies for Nutrition Action, Wellington, September 2013) Agencies for Nutrition Action <www.ana.org.nz/our-work>.
160 See “Coke’s new anti-obesity moves slammed” ONE News (23 July 2013) <www.tvnz.co.nz/national-news>.
161 Above n 157.
162 The Health Research Council of New Zealand has recently funded a five-year, $5 million study to explore the causes of the obesity problem and to identify solutions to combat this problem; see Jamie Morton “Science that will change our lives: Race to stop us eating our way to early death” The New Zealand Herald (online ed, Auckland, 6 January 2014).
163 See Fletcher, Frisvold and Tefft, above n 59.
164 See Briggs and others, above n 13.
165 See Holmes and Pinny, above n 147.
166 See Scott Drenkard “The Evidence on Sugar and Snack Taxes” (2013) 31 Journal of State Taxation 39.
167 See Rao and others, above n 80.
About the authors
 Lin Mei Tan (left) is a Senior Lecturer in the School of Accountancy at Massey University, Palmerston North.
James Xun Liu is an Intern in the Department of Accounting at the Bank of China.